Here’s an exercise I proposed in an online competition. You have the following sequence: Find the integer part of: Now, notice that Hence By substitution, we have that the sum telescopes and reduces to Since is a very large number (the sequence has a quadratic increasing rate), we have that the integer part of the […]
Month: January 2021
The Earthsea Saga
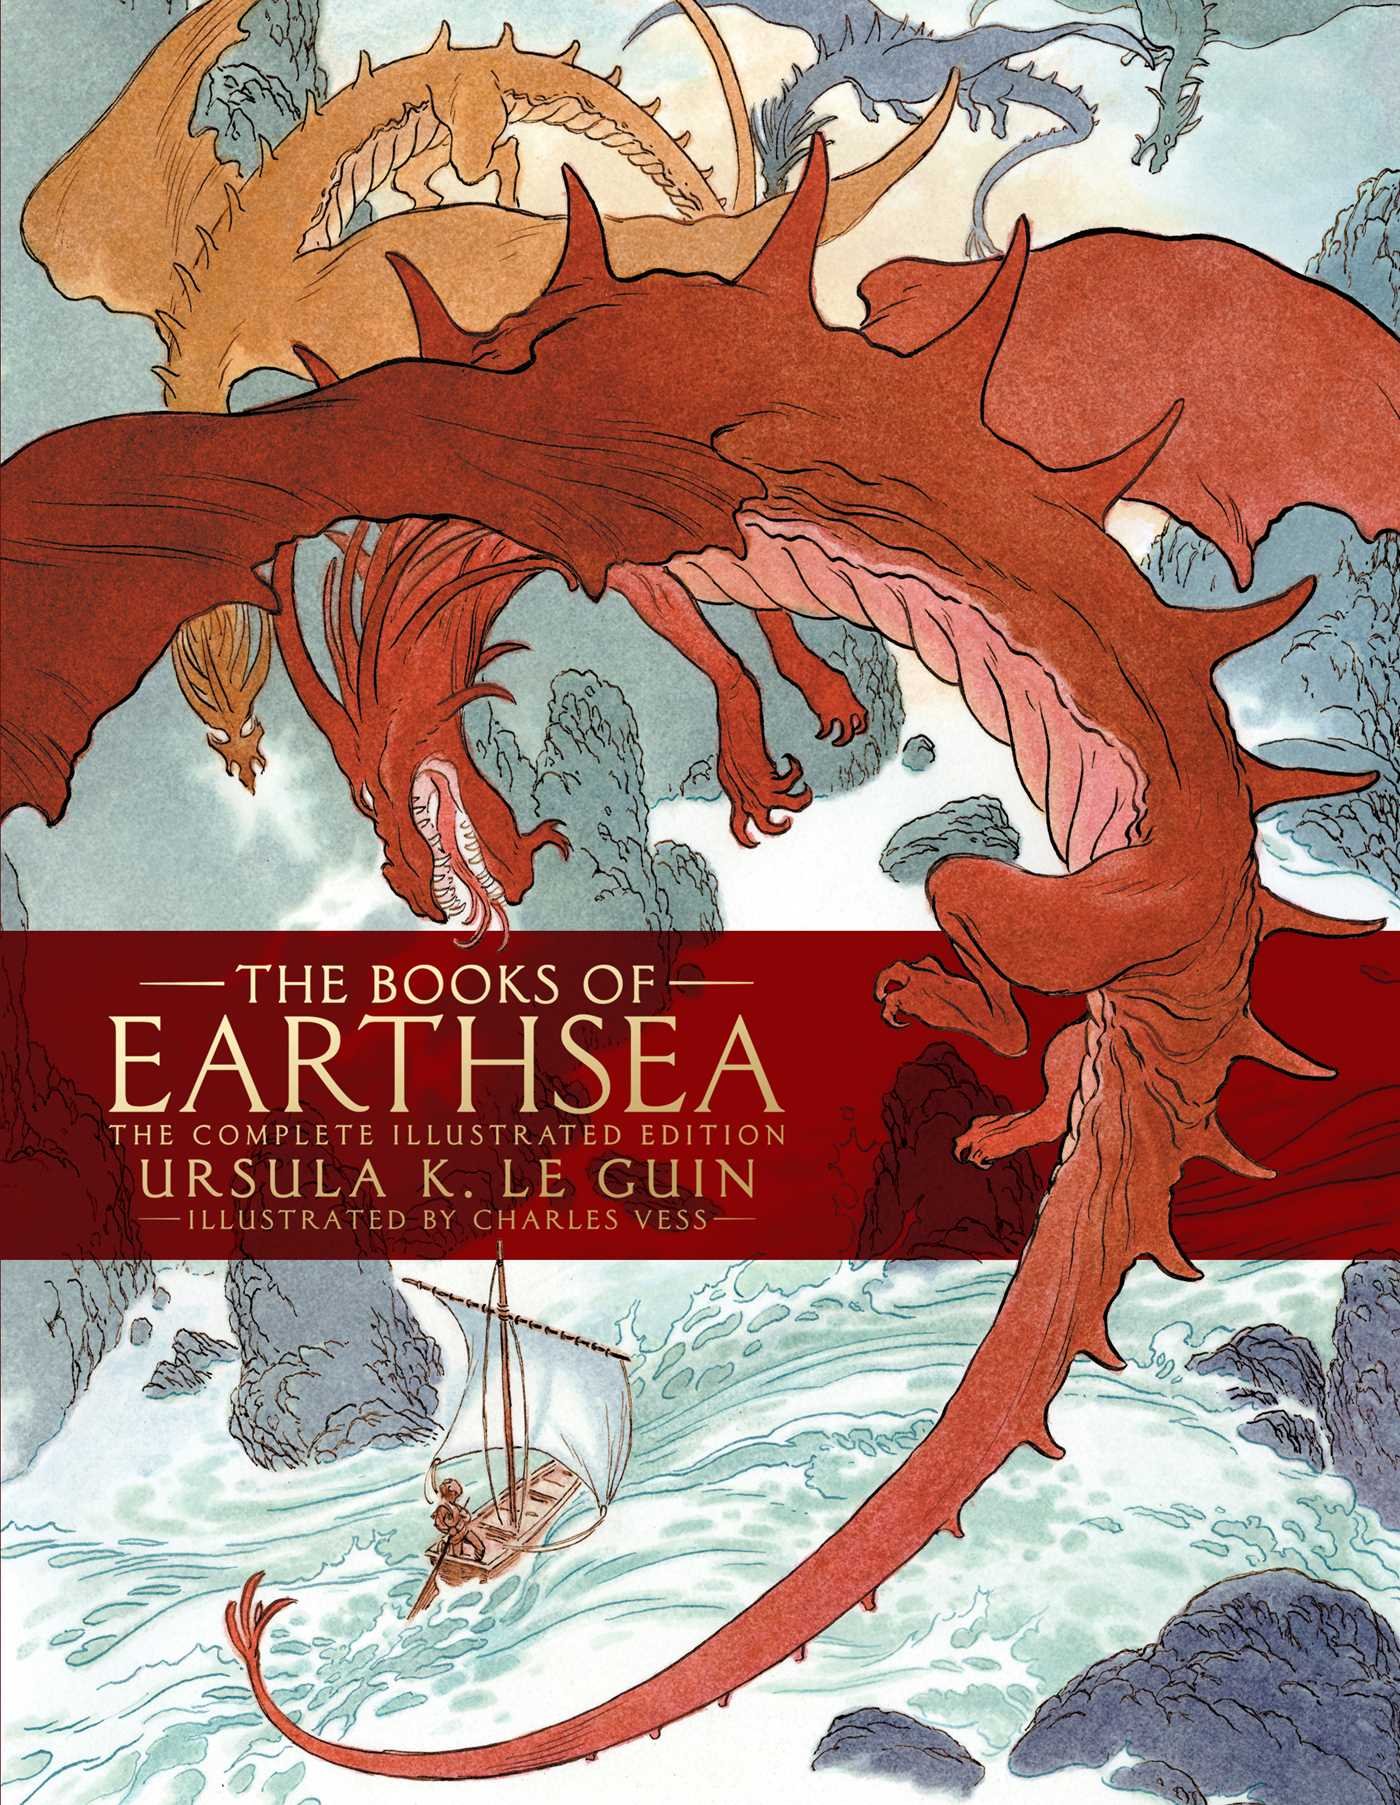
The Earthsea saga, by Ursula K. Le Guin, is a collection of fantasy books I particularly enjoyed. It talks about a world of magical creatures that live together in harmony. Some humans have the power to cast magic spells and control nature. The most gifted and powerful ones gather on the island of Roke, where […]
The Sicilian Defense May Be Nasty

Here’s a game I played with white in the Sicilian Defense which really shows how the Sicilian is a double-edge defense. 1. e4 c5 2. Nf3 Nc6 3. d4 cxd4 4. Nxd4 Nf6 5. Nc3 e6 6. f3 a6 7. Bc4 Bb4 8. Nxc6 bxc6 9. Bd2 d5 Here I should have gone for e5 […]
IMO 2007/2
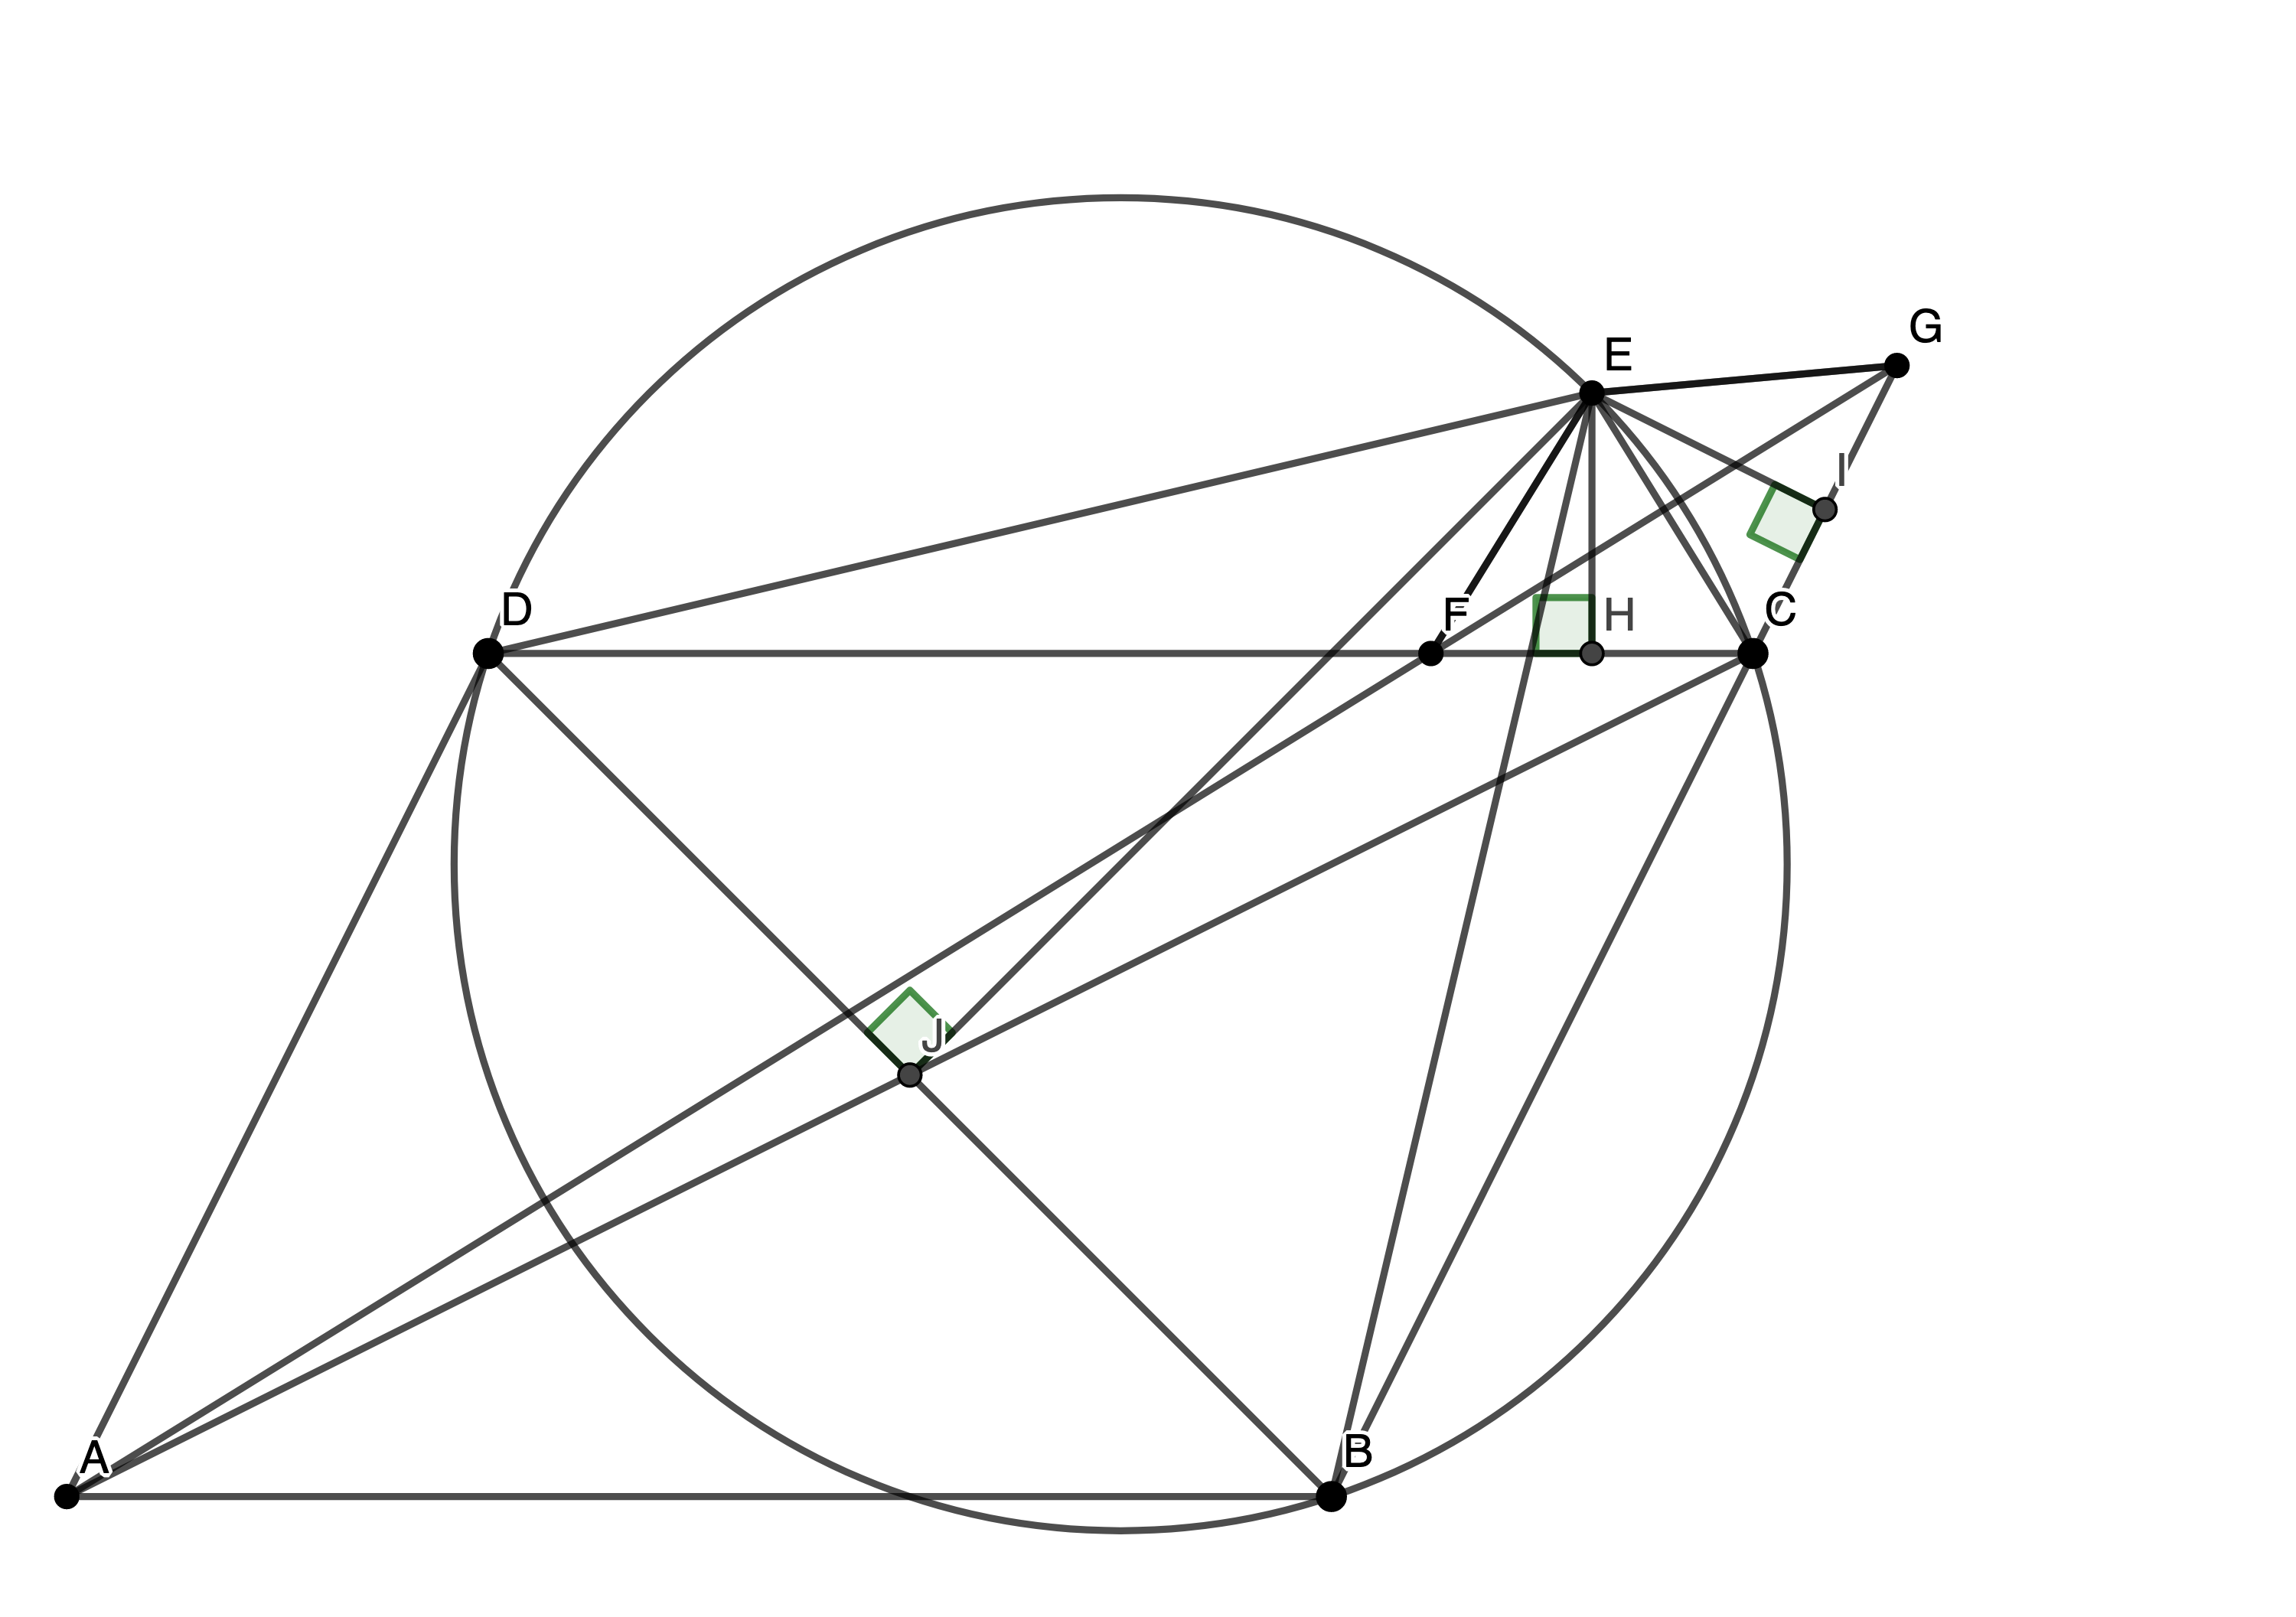
Consider five points A, B, C, D, E such that ABCD is a parallelogram and BCED is a cyclic quadrilateral. Let l be a line passing through A. Suppose that l intersects the interior of the segment DC at F and intersects line BC at G. Suppose also that EF = EG = EC. Prove […]
Vishwanathan Anand
Vishwanathan ‘Vishy’ Anand is one of my favourite chess players. He was the world champion before Magnus took the throne in 2013. Vishy is a very aggressive and creative player. Here are some of my favourite games he played. He became world champion in 2007 and held it against Kramnik (2008), Topalov (2010) and Gelfand(2012). […]
An Old Birthday Gift
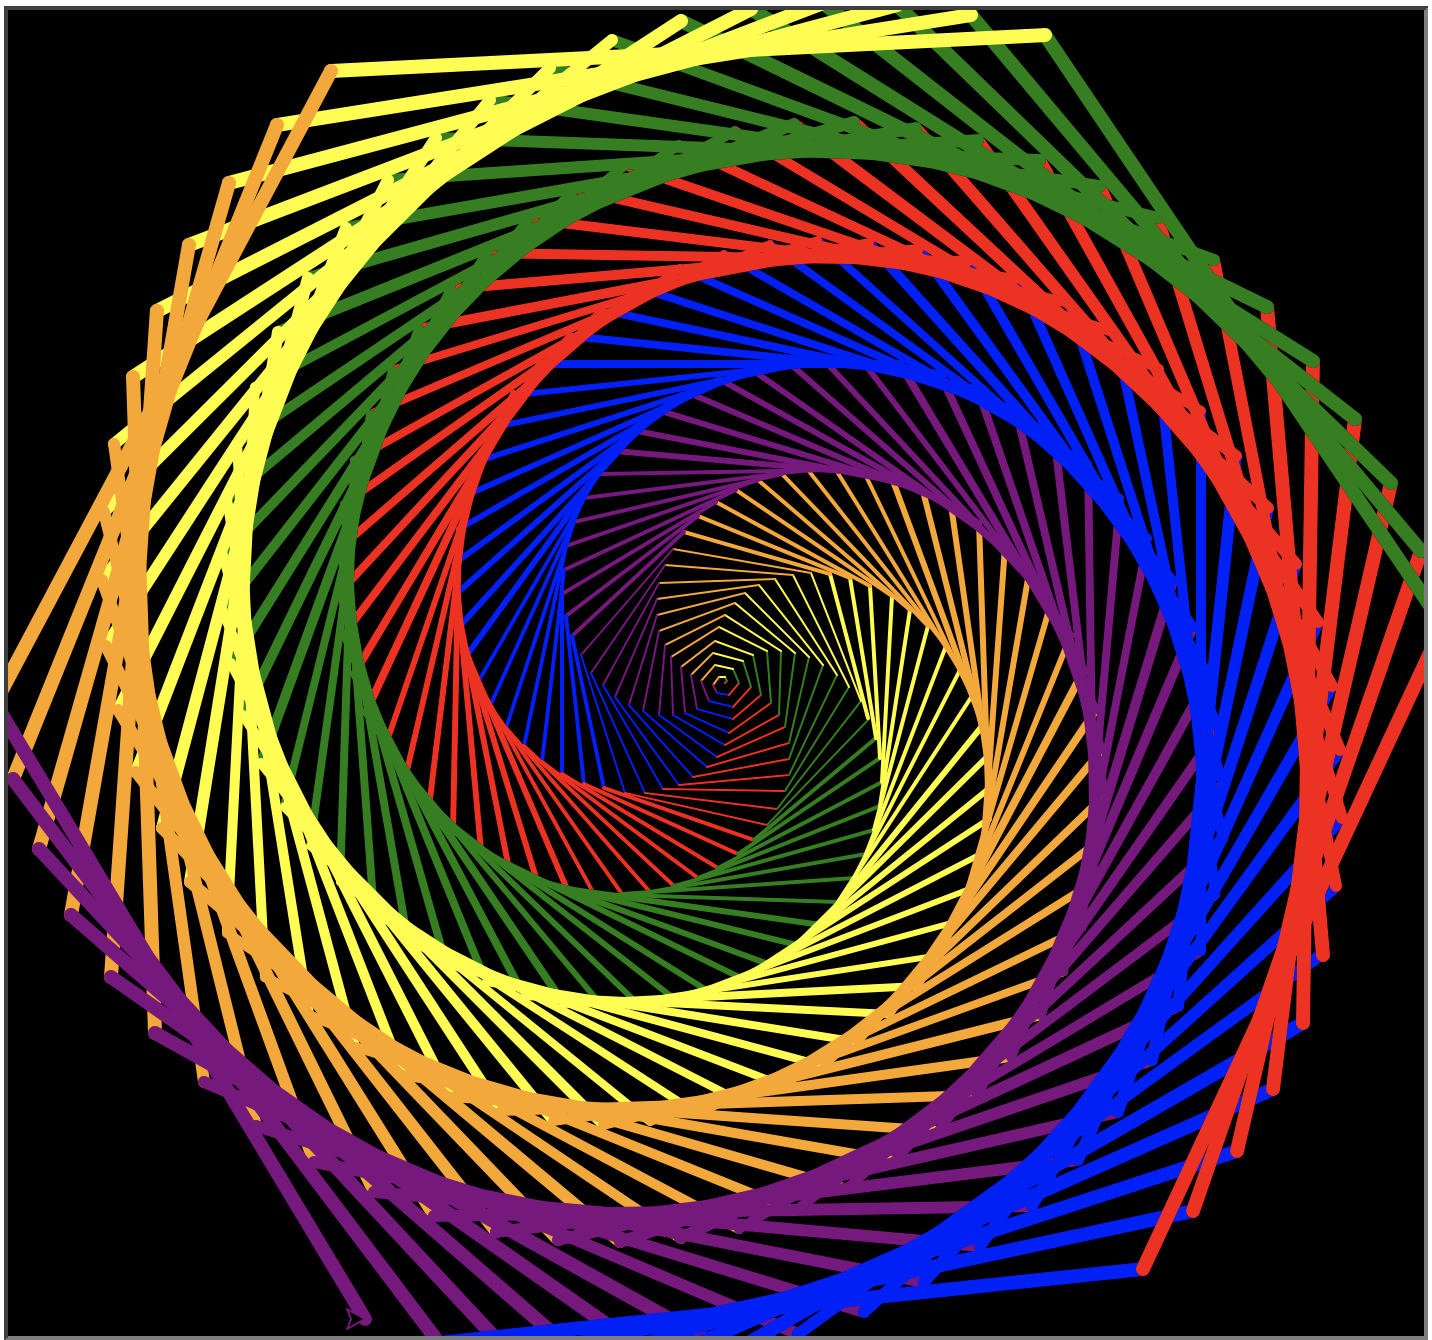
This is an old birthday gift for a special person. It was the first time I tried to plot something using python, and I wasn’t very familiar with matplotlib, so I used the turtle library. import turtleimport timedef auguri(): colors = [‘blue’, ‘red’, ‘green’, ‘yellow’, ‘orange’, ‘purple’] turtle.pensize(5) turtle.bgcolor(‘black’) turtle.speed(1000) for x in range(360): turtle.pencolor(colors[x […]
Chick Corea
Chick Corea is by far my favourite pianist. He’s won 23 grammy awards and he’s written 2 of my 3 favourite pieces of all time. He can literally play anything, but I think that his genius is expressed by latin music. In fact, the 2 pieces I love are Spain and Armando’s Rhumba. These are […]
Plotting 3D Lines
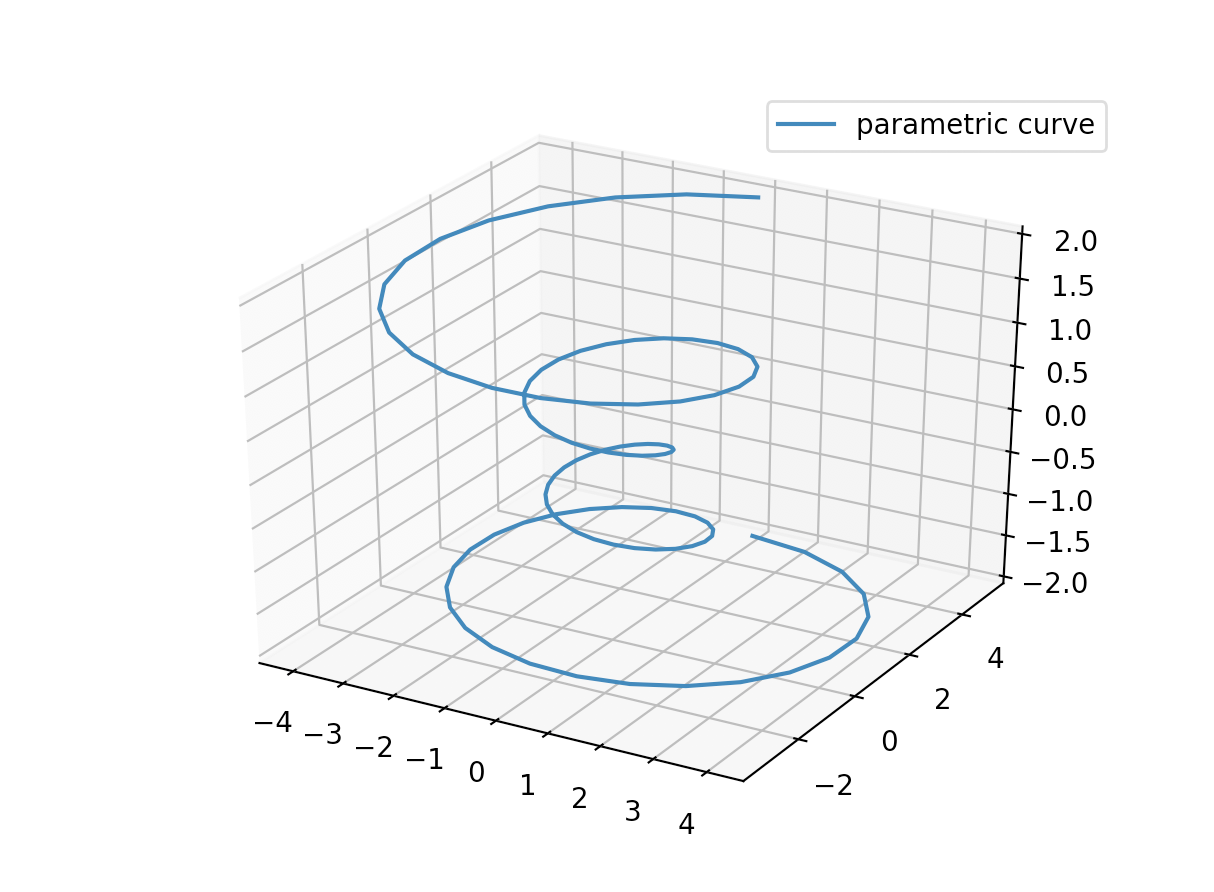
In Python as you know there’s the option of plotting 3D graphs, so why not fully exploiting such possibilities? In this example I will show a sort of an irregular spiral figure. import matplotlib as mplimport numpy as npimport matplotlib.pyplot as pltmpl.rcParams[‘legend.fontsize’] = 10fig = plt.figure()ax = fig.gca(projection=’3d’)theta = np.linspace(-4 * np.pi, 4 * np.pi, […]
Multiple Days Stock Predictor
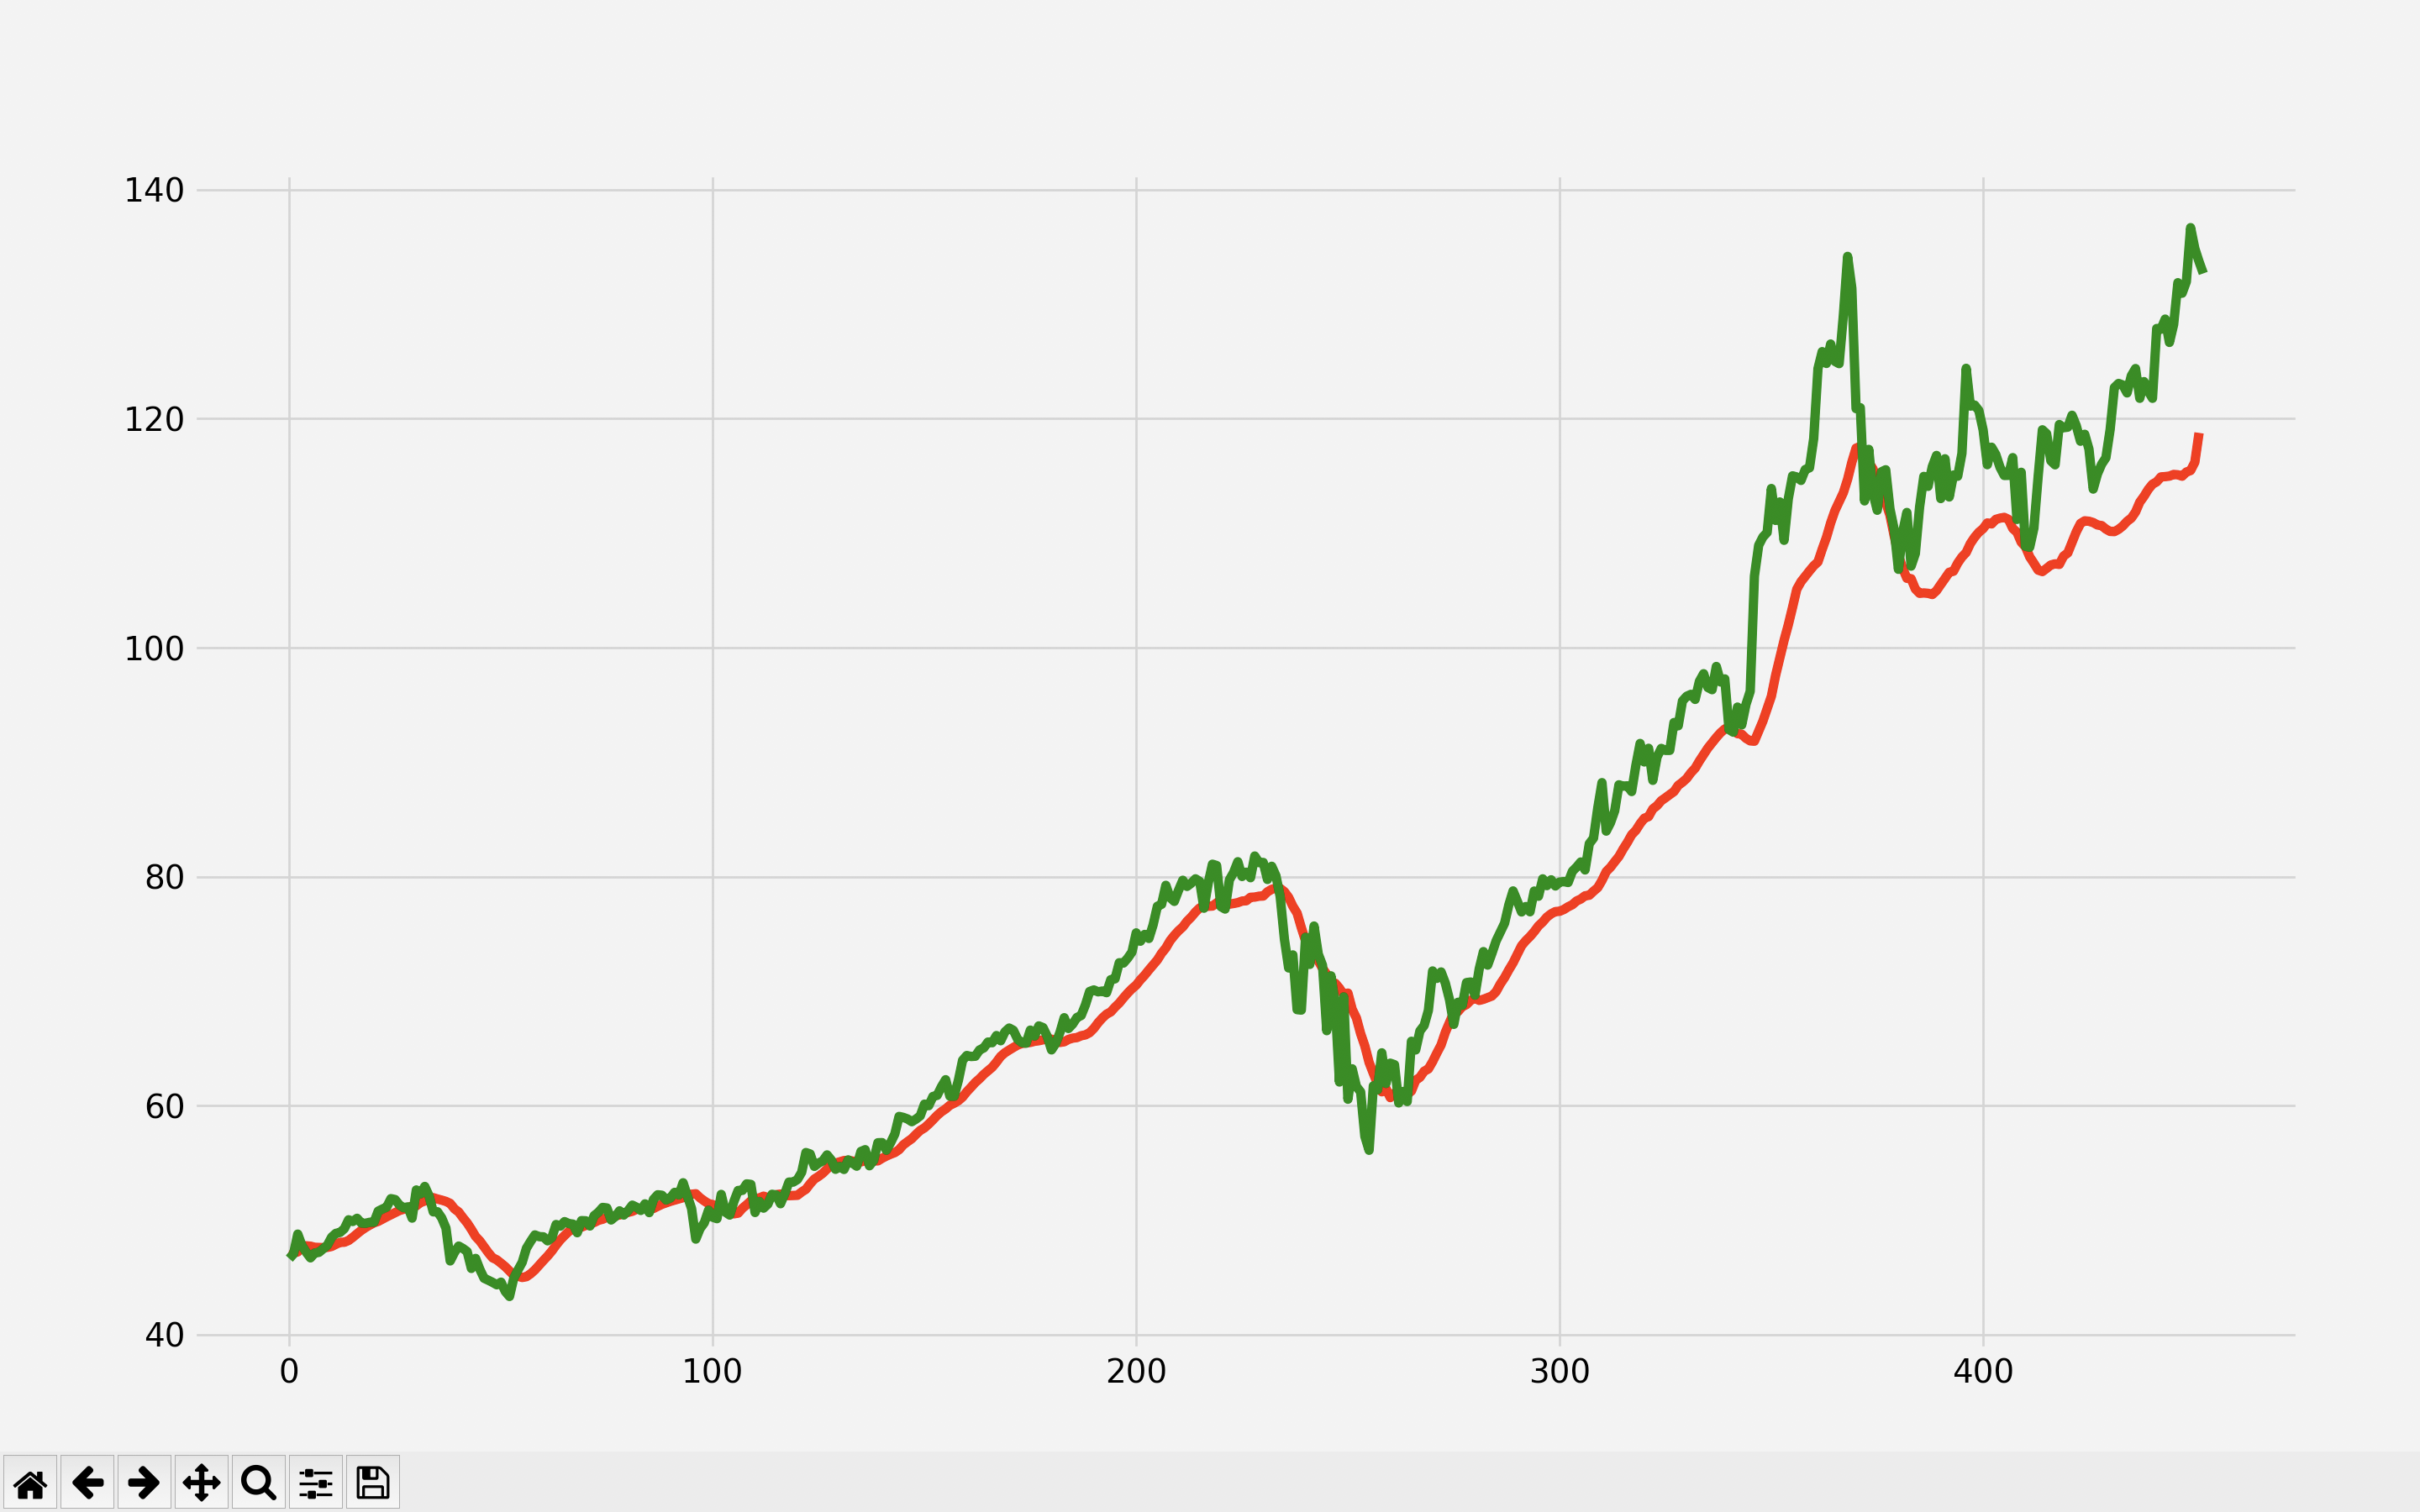
The last stock predictor could only predict the following day based on the last n days. Now it can predict any number of days ahead. Since when you try to predict more days ahead some may overlap, this plot is made by taking the mean of all the overlapping days. Hence, it’s not very accurate, […]
An Application Of Burnside’s Lemma
Burnside’s Lemma is a very nice tool I had the occasion to use in the Mathematical Olympiads to solve some Combinatorics problems. It says that, given a finite group acting on a set , and, for each : let be the elements of invariant by . Then the number of orbits is equal to: May […]