In my school course ‘Python For Physics’ we had to choose among some topics to study and implement in Python, and I and my colleague decided to go for the Lorenz Attractor equations.
The Lorenz System is a system of differential equations which generates a very chaotic plot, where chaotic means that little variations may cause enormous difference in position, which means that we are not able to properly predict the position of the particle in such system. That’s why the weather predictions are often inaccurate.
Its equations are:
Now let’s look at the Python Implementation:
o = 10
l = 8/3
dt = 0.001
p = 28


def equations(a, b, c):
    return o*(b-a), p*a-a*c-b, a*b-l*c


def get_function_points(x, y, z, file_name):
    header = 'x,y,z'+'\n'
    t = 3
    x_coords = []
    y_coords = []
    z_coords = []
    lorenz = open(file_name, "w")
    lorenz.write(header)
    for i in range(100000):
        dxdt, dydt, dzdt = equations(x, y, z)
        dx = dt * dxdt
        dy = dt * dydt
        dz = dt * dzdt
        x = x + dx
        y = y + dy
        z = z + dz
        t = t + dt
        x_coords.append(x)
        y_coords.append(y)
        z_coords.append(z)
        stringa = str(x) + "," + str(y) + "," + str(z) + "\n"

        lorenz.write(stringa)
    lorenz.close()
    return x_coords, y_coords, z_coords


first = get_function_points(1, 0, 0, 'lorenz.txt')
second = get_function_points(1.1, 0.1, 0.1, 'lorenz2.txt')
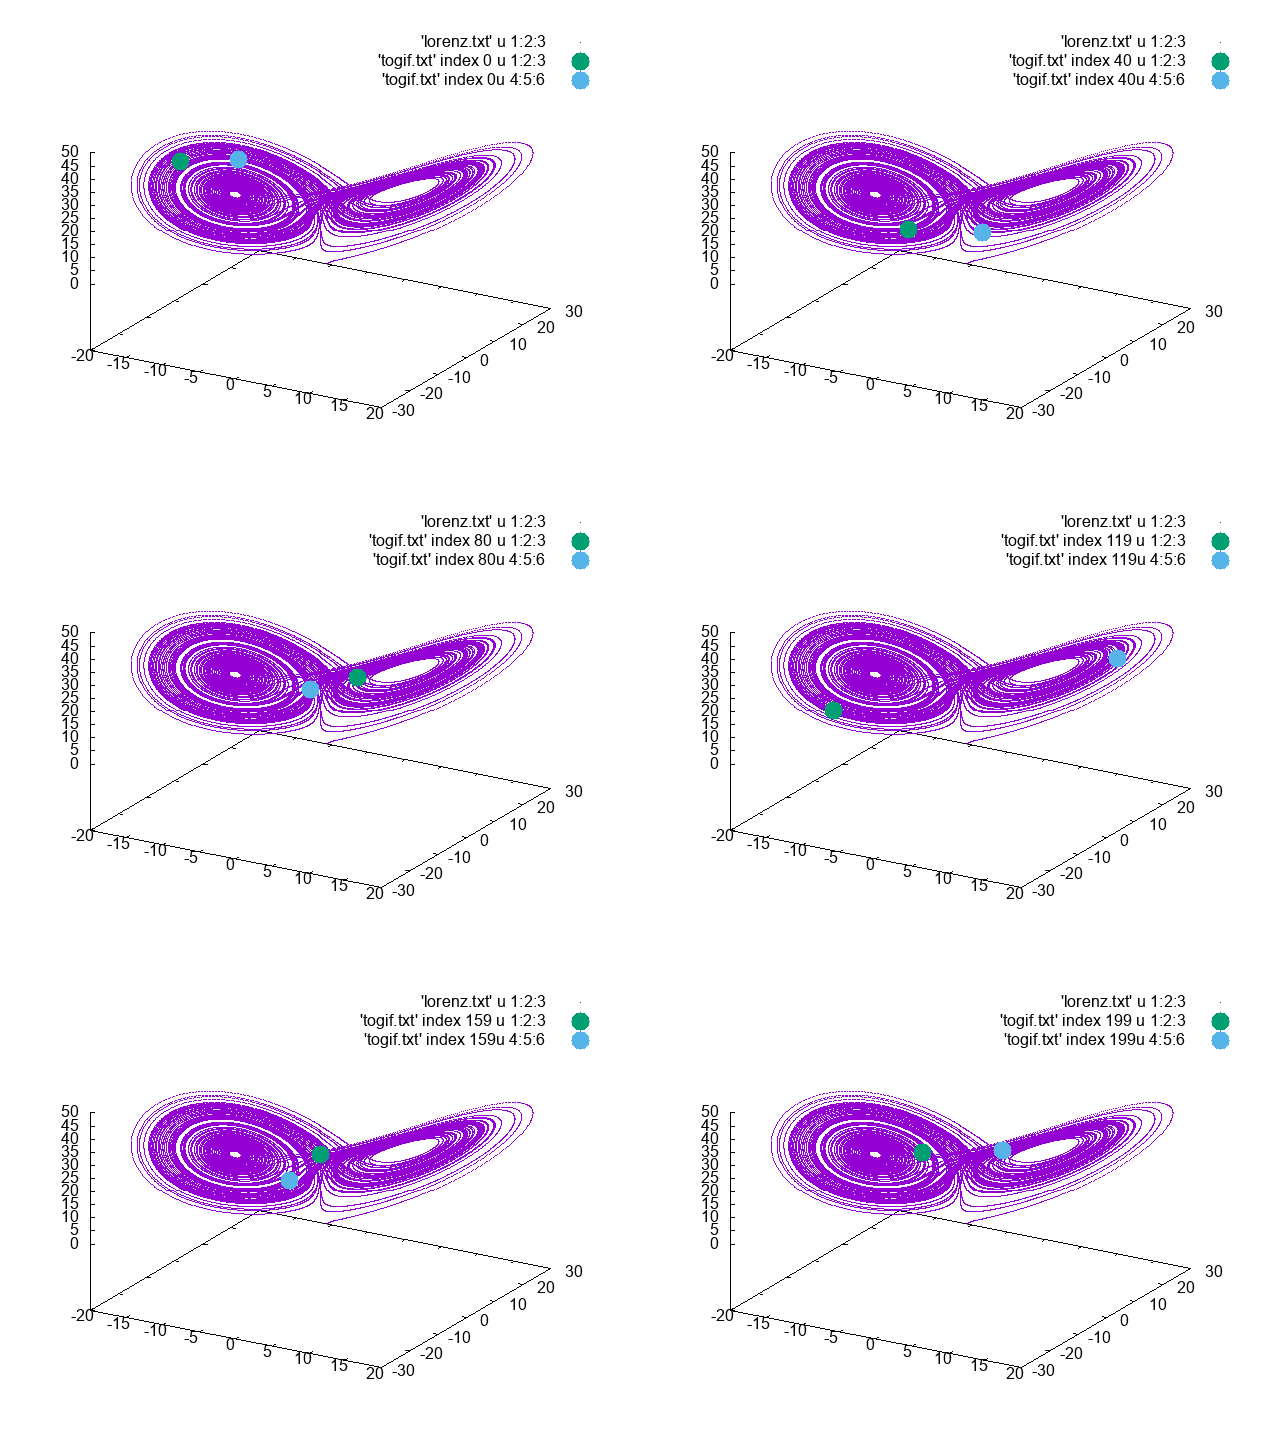
Now we have the equations that begin from two very close points in two txt files. Our scope was making a gif that shows how can a little variation produce a big change: the particle goes on the other wing of the butterfly.
Now the next Python File reads through the txt files and gets the points I want to plot (the moment when a particle changes wing).
final = open('togif.txt', 'w')
with open('lorenz2.txt', 'r') as file:
    with open('lorenz.txt', 'r') as file1:
        for i in range(14999):
            file.readline()
            file1.readline()

        for i in range(10000):
            a = file.readline().rstrip()+' '
            b = file1.readline()
            if i % 50 == 0:
                final.write(a+b+'\n\n')

final.close()
Now we use gnuplot to make a gif and to write the gnu file I used a Python file.
with open('film.gnu', 'w') as file:
    file.write('set term gif animate; set output "filmino.gif"'+'\n')
    for i in range(200):
        string = "sp 'lorenz.txt' u 1:2:3 w d,'togif.txt' index " + str(i) +" u 1:2:3 w p pt 7 ps 3,'togif.txt' index " + str(i) + "u 4:5:6 w p pt 7 ps 3"
        file.write(string+'\n')
The output is what follows:
