In this article, I’ll show you five different equations you can use to plot your own heart.
Let’s start with the simplest:
^3 -x^2y^3 = 0")
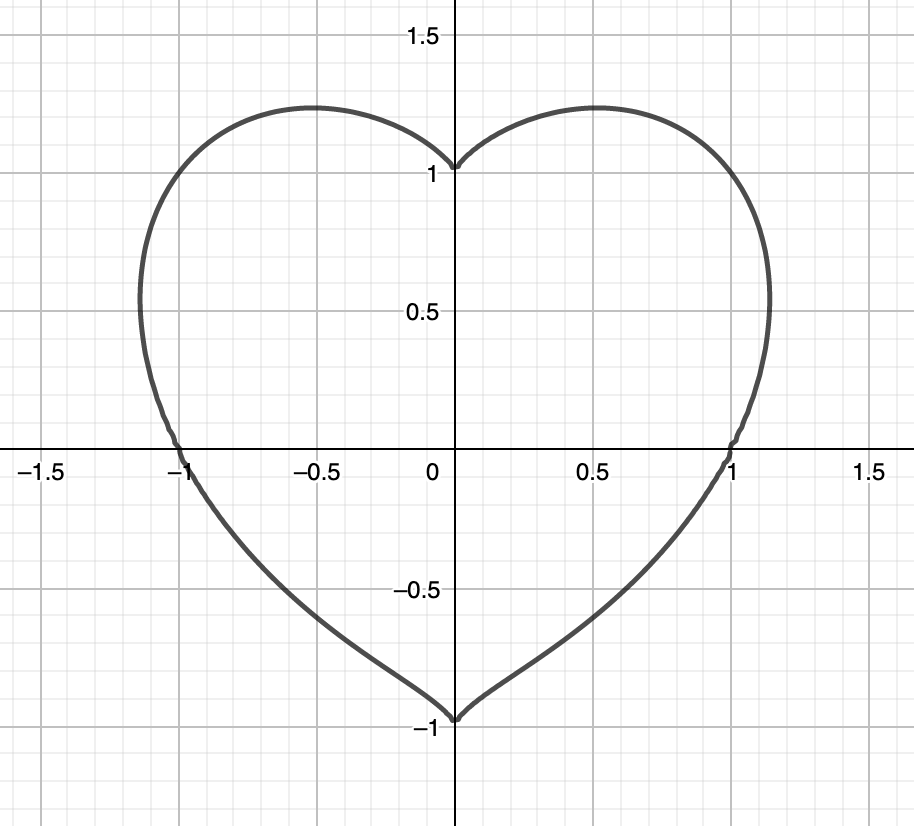
I think this is the most classic of the five I’m going to show you.
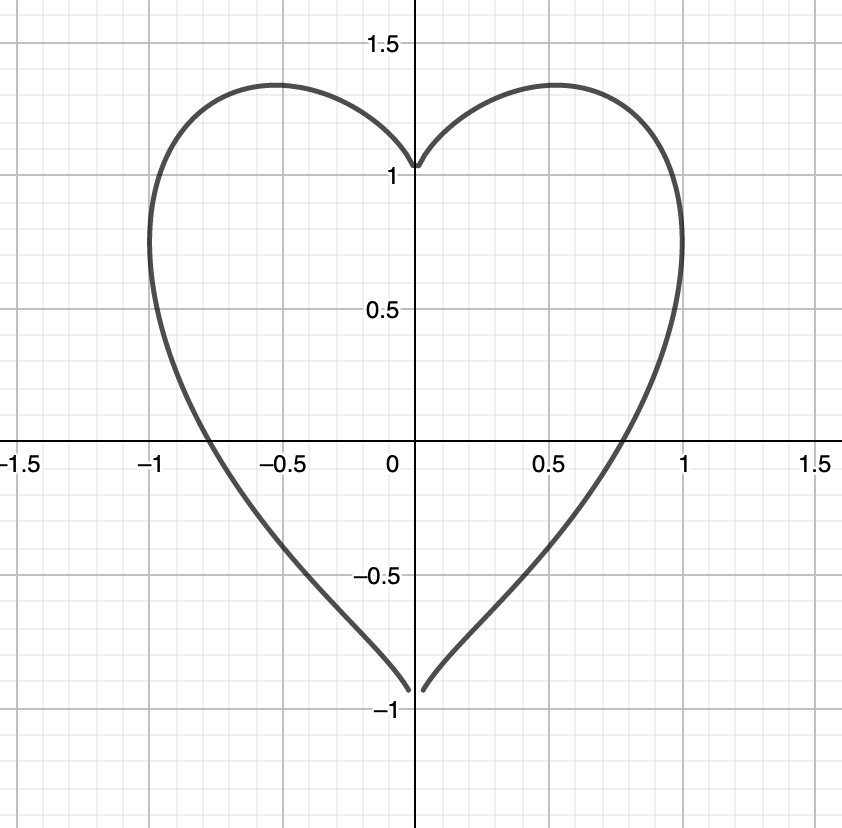
If you prefer one which is a little bit thinner, there is this one:
^2 = 1 - x^2")
On the other hand, there is also one that is fatter:
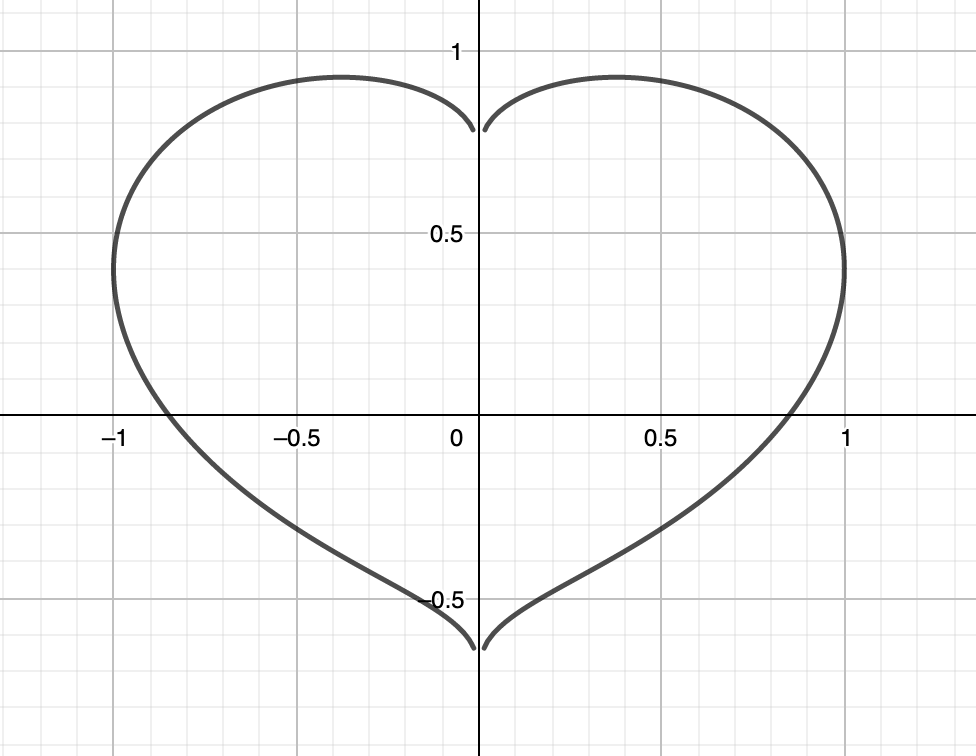
^2 - 1 = 0")
Python Implementation For Plotting Two Parametric Hearts
To plot the hearts, I’m using the numpy and matplotlib libraries of Python.
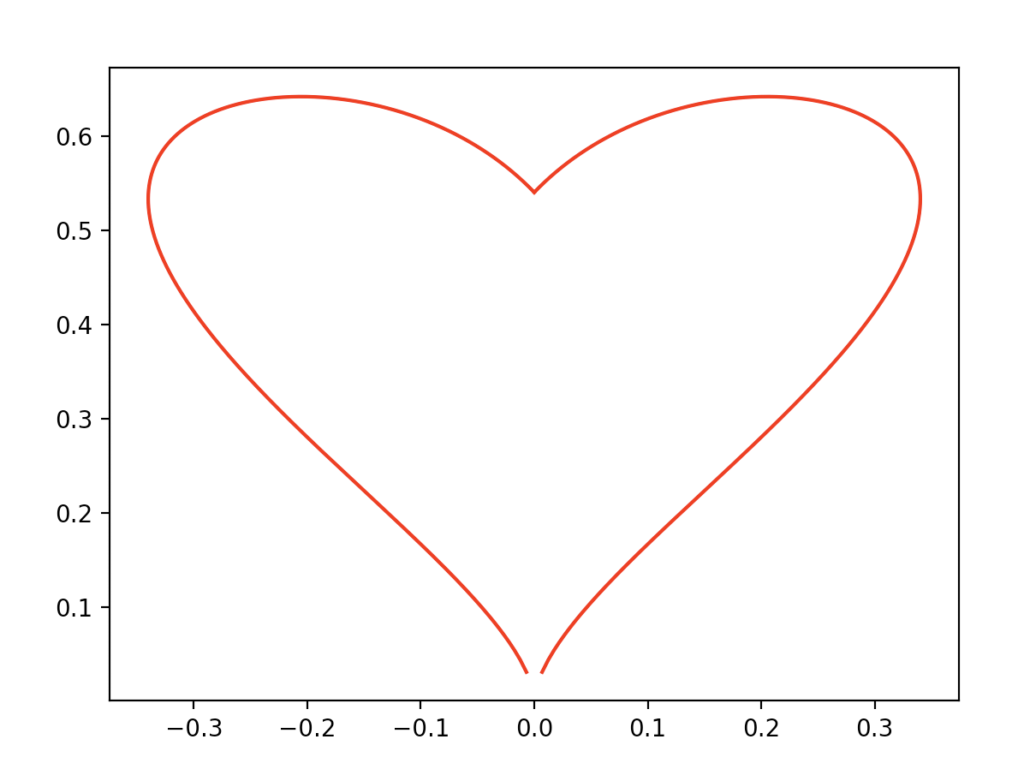
The first parametric equation is:
\sin{\frac{t}{90}} \\ y = (-t^2+40t+1200)\cos{\frac{t}{60}} \end{cases}")
Where

Its code implementation is:
import numpy as np
import matplotlib.pyplot as plt


def heart_plotter(precision):
    t = np.linspace(0, 60, precision)
    X = 1/100*(-t**2 + 40*t + 1200)*np.sin(t/90)
    Y = 1/100*(-t**2 + 40*t + 1200)*np.cos(t/60)
    Y_1 = 1/100*(-t**2 + 40*t + 1200)*np.cos(t/60)
    X_1 = -1/100*(-t**2 + 40*t + 1200)*np.sin(t/90)

    X = np.concatenate((X, np.flip(X_1)))
    Y = np.concatenate((Y, np.flip(Y_1)))

    return X, Y


x, y = heart_plotter(1000)
plt.plot(x, y, c='r')
plt.show()
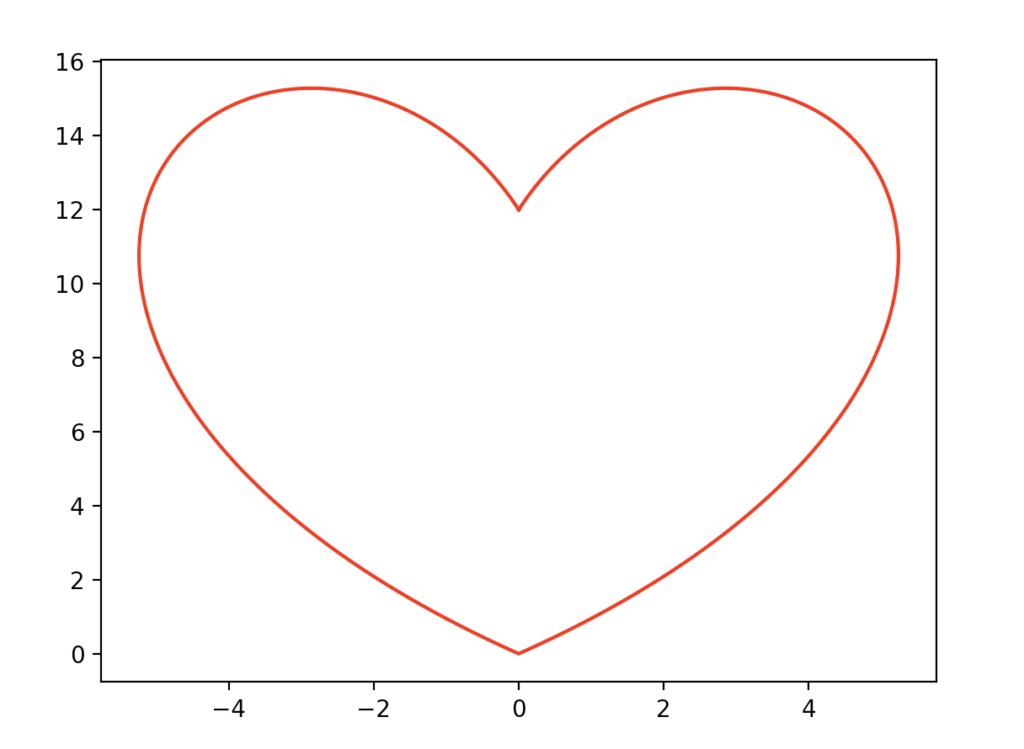
A very classic shape. As you can see it’s very easy to perform calculations with numpy arrays and its builtin functions.
Warning: if you don’t reverse the order of the arrays before concatenating (np.flip), the line x=0 would appear in the plot connecting the two ‘cusps’ of the heart, because the plot function of matplotlib would think there’s a gap in the graph of the equation.
The second parametric equation is the one I prefer:

Where

Its code implementation is:
import numpy as np
import matplotlib.pyplot as plt


def heart_plotter(precision):
    t = np.linspace(-1, 1, 2*precision+1)
    X = np.sin(t)*np.cos(t)*np.log(np.abs(t))
    Y = np.sqrt(np.abs(t))*np.cos(t)

    return X, Y


x, y = heart_plotter(1000)
plt.plot(x, y, c='r')
plt.show()
I really like the shape of this heart, it seems like it’s constantly expanding.
I’m using 2*precision + 1 because, this way, there is that little gap near 0. If precision was even, there would be a line joining the two borders, which is not very aesthetically pleasing.